Sunday, November 20, 2011

Racial Maps and Comments


The above map is a color represented percentage of 'Some Other Population' in the census website (www.census.gov) in the year 2000. Although the census map doesn't specify which which racial category it actually is, it is most likely that of Hispanics. Unfortunately, I wasn't able to make the key for this map describing how much population is within each individual color, and the same goes for the rest of the following maps. However, it is safe to say that the darker the colors are, the more densely populated the areas are. In this map, the darkest color is the purple and it shows that the more populated areas are in the southwest.
This second map is another colored map representing the estimated Asian population in the U.S in the year 2000 taken from information from the same census website mentioned above. Again the darkest colors (in this case, the darkest blue) are the most densely populated areas. Here, it is easy to tell that of the many general areas of concentrated Asian populations, the most lies in the southwest coast. The single most densely populated area is the San Francisco bay area in the western coast in California. Other regions include the northwestern coast, Florida, and the New England area (the northeast coast).

(Correction: the grey area in the middle is actually a zoomed out version of the 'Some Other Population Alone' map left 'visible' when the map was saved as a jpeg image).
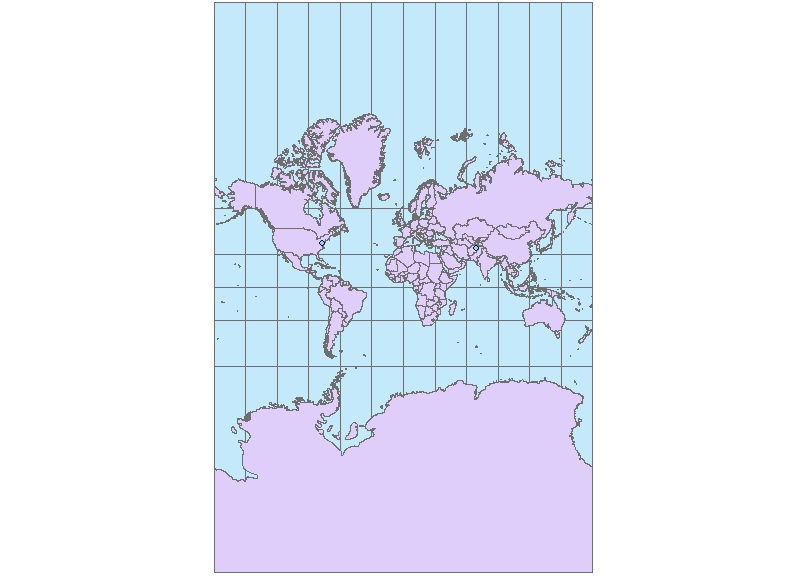
Here is the black population in the year 2000 according to the census website in another color represented map. Unfortunately, an unknown problem in the Arcmap GIS program kept the map from appearing in the 'layout view.' Here, the darkest colors are again the most populated regions and that appears to be in the southeast region of the U.S.

Census map series here could have been slightly better with a few touch ups, but generally the necessary information is shown. The maps show that population can vary drastically among regions and that stereotypical assumptions can be proven wrong when the surveyed information can be put into a map. My overall impression of GIS is actually that of impressed how easy it could be. With a good amount of time one would be able to get a real grasp on the program. I actually thought it would be harder. With that said, I do admit it was difficult. However, the basic concept can become familiar (with practice) and even become exciting depending on the type of information being dealt with.

Tuesday, November 8, 2011

Northern Grand Canyon (Week 7 Lab)

I selected a section of the Northern Grand Canyon in Arizona, U.S. because, it not only has great features in terms of varying elevation (cliffs, peaks, and small valleys), it's easily recognizable as one of the most well known features on the Earth. Digital Elevation Models have a large scale of uses. These programs can be used for studying habitats. This could help scientists get a good idea of the kind of wildlife that could live within the area. They can also be used to study vegetation, and in this particular case the elevation could answer why plants are scarce in the Grand Canyon. Animal migrations can be studied through this because the elevation differences in the land can imply the future temperatures in the area in different seasons. The program could also be useful as references for natural disasters. Such as the effects of a flash flood (which would be very interesting in this particular area), the possibility of a tornado (which would be pretty low in the grand canyon), and the changes in seismic activity (for example: if a magma chamber existed underground, it would create changes in elevation in the land above it like Yellowstone National Park).
The GCS (Geographic Coordinate System): GCS_North American_1983 is the spatial reference.
The Extent Information in (Decimal Degrees)
- Top: 36.5247222215
- Left: -112.557777777
- Right: -111.819722221
- Bottom: 36.0538888881


Sunday, November 6, 2011

Six Map Layers and the Significance of Map Projections

Mercator Map (Conformal)
Two Point Equidistant
Cylindrical Equal Area
Equidistant Cylindrical
Pole Lambert Azimuthal Equal Area
World Stereographic (Conformal)

     There are various types of map projections. Some can look like a realistic view of the earth from space while others shape the earth in ways that make it completely unrecognizable. Each projection has its own distinct properties and therefore they have their own functions.
     Certain maps are better for navigation. Specifically the conformal types of maps. These maps have lines that are the incidental. Meaning they have parallel line that keep the shape of the earth more or less accurate. Conformal types of maps are also known as orthomorphic map projections. The Mercator projection and the Stereographic projections are both conformal and although they don't keep the exact shape of large objects like the continents (especially Africa) they have a consistent direction throughout all points on the map. The Mercator projection is even used for marine navigation.
     There are more Equidistant maps than other types of map projections. Equidistant maps have certain uses that rely more on proportionate distances rather than actual angles. They always keep the scale consistent. These projections are large scale and are mostly used for air travel, like the equidistant cylindrical map projection above.
     Equal Area maps are mostly used for geology mostly because they (you guessed it) preserve area. They correct the mistake of the Mercator projection that shows Greenland a few times larger than it should be, making it larger than Africa. For example: the Equidistant Cylindrical (shown above) clearly shows the difference in size between Greenland and Africa. Map projections are generally important because they let us understand our positions in the earth at any given point not only through visuals but through mathematical analysis (making us albe to navigate ourselves accurately)